Mid-Year Update: B.C. Home Price Forecast to End of 2019
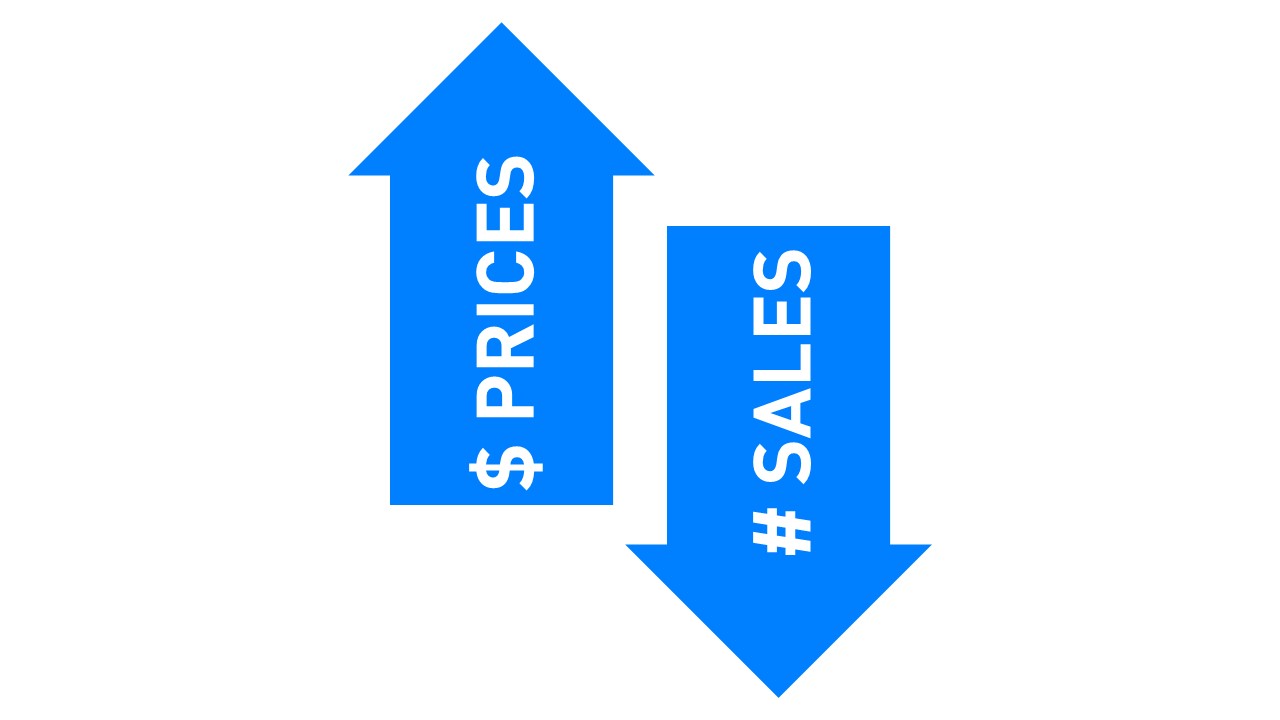
Every quarter, we summarize the various forecasts and provide additional insight into what to expect and why. Some major Canadian financial institutions and real estate boards have released updated mid-year forecasts and most expect prices to rise over the next 18 months but sales volume, already significantly lower than previous years, is set to continue dropping.
RBC has a very different perspective than other economists, with both their home price and mortgage rate forecast signalling a rise followed by a drop. The Canadian Real Estate Association (CREA) has revised their forecast from earlier this year to show significantly lower sales activity, they now predict 11% fewer homes to be sold in 2018 compared to 2017.
BC Price Forecasts
|
BC Price Forecast |
2018F |
2018 YoY Change |
2019F |
2019 YoY Change |
|
RBC |
$828,600 |
5.2% |
$818,100 |
- 1.3% |
|
BC REA |
$745,600 |
5.1% |
$775,900 |
4.1% |
|
Central 1 |
$532,000 |
6.4% |
$545,000 |
2.4% |
|
CREA |
$733,900 |
3.4% |
$747,100 |
1.8% |
| Good for buyers | Good for sellers |
Though prices are continuing to rise, most of the upward pressure is due to townhouse and condo price growth. Those hoping that new BC NDP Housing Strategy measures would result in a price correction are likely disappointed that the only major effect thus far has been slower price growth and reduced total sales volume. Nevertheless, many of the government measures have not yet come into effect so uncertainty in the market will likely persist.
From the chart below, it is worth noting that single detached home prices have levelled off (and even dropped slightly) since the peak last August. The chart also neatly demonstrates the growth of condo prices in comparison to those of single detached homes. Since August 2017, the gap between the price of a condo vs a detached home has closed by almost $100k.
Greater Vancouver Home Prices - By Type
So far this year Greater Vancouver apartment prices have risen 5% and BC REA is expecting prices to rise another 10% before moderating in 2019. From our perspective, this may be a bit optimistic since traditionally the 2nd half of the year is usually softer than sales in the Spring.
Interestingly, the sales outlook for the entire Lower Mainland is far more optimistic for sellers than that of Greater Vancouver – prices in Abbotsford and Chilliwack are rising like never before!
Lower Mainland Home Price Forecast -By Type
(Including Greater Vancouver)
|
Home Type |
2017 Benchmark Price |
2018F |
YoY Change |
2019F |
YoY Change |
|
All |
$ 1,031,546 |
$1,080,000 |
4.7% |
$1,104,900 |
2.3% |
|
Detached Home |
$ 1,752,247 |
$ 1,720,000 |
- 1.8% |
$ 1,730,000 |
0.6% |
|
Townhouse |
$ 861,393 |
$ 960,300 |
11.5% |
$ 1,004,500 |
4.2% |
|
Apartment |
$ 647,651 |
$ 754,000 |
15% |
$ 776,300 |
4.2% |
Why is this all happening?
Greater Vancouver condo and townhouse prices are still soaring and there’s been a significant increase in the number of houses sold in cities outside of Greater Vancouver. We are seeing this trend because Greater Vancouver house prices are so far out of reach that they are forcing potential home buyers to either stay in the city by buying a condo, or move further away from Vancouver to find their dream home.
Alongside that are the key factors at play in the market. With house prices still rising, albeit at a slower rate than we’ve become accustomed to, it suggests that the factors pushing prices upward (in grey) are more powerful than downward forces (in orange) like reduced mortgage financing and government intervention.
In summary, over the next 18 months we expect house sales activity will stay historically low and price growth will remain flat. People in the city that are looking to buy will either: buy a condo or move further into the Lower Mainland. We expect this to be the state of the market for the foreseeable future, the housing boom in Vancouver may at long last be coming back to Earth. Perhaps, this may even occur without a major recession or correction in the housing industry.
A word of caution, in the first 5 months of 2016 there was on average 3 months of supply of singe detached houses for sale but in the first 5 months of 2018 the city averaged 11 months of supply. If more homes are listed and even a small fraction of sellers drop their asking prices to avoid 11 months of open houses then we may see house prices slide.
We recommend you also read this article on the current risks present in the real estate market.
Like this post? Like us on Facebook for the next one in your feed.

Your 5 Essential Steps for Successful Home Buying

Empowering Homebuyers
|
Home Type |
2017 Benchmark Price |
2018F |
YoY Change |
2019F |
YoY Change |
|
All |
$ 732,762 |
$ 787,900 |
9% |
$1,104,900 |
3.6% |
|
Detached Home |
$ 1,133,226 |
$ 1,160,967 |
5% |
$ 1,730,000 |
1.6% |
|
Townhouse |
$ 599,830 |
$ 674,433 |
13% |
$ 1,004,500 |
3.9% |
|
Apartment |
$ 396,225 |
$ 465,653 |
18% |
$ 776,300 |
4.3% |


